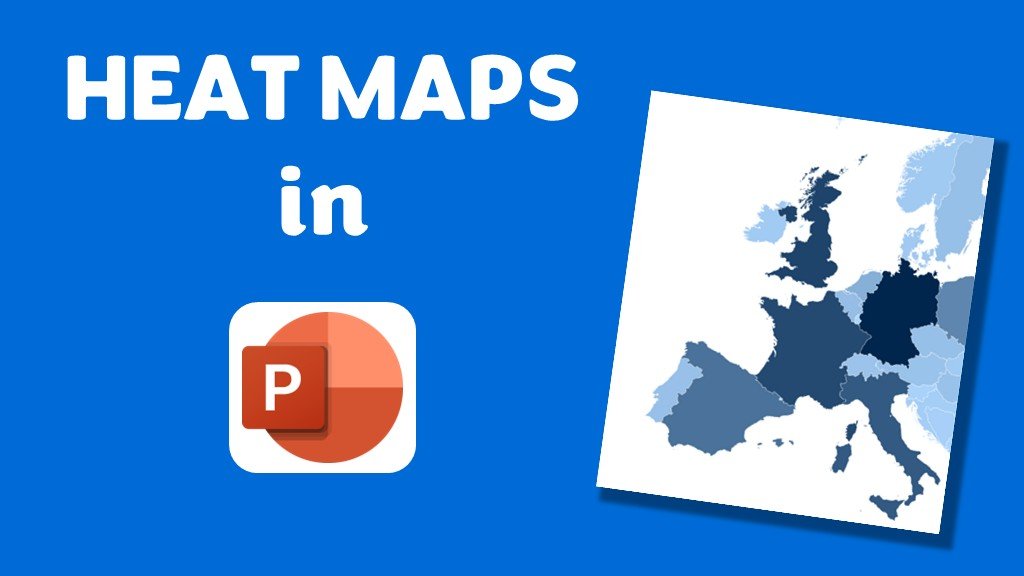
How to create a Heat Map in PowerPoint
Heat maps are a powerful way to visualise data, using colour intensity to representdifferent values. Whether you’re highlighting population density, sales performance,or survey results, a

Heat maps are a powerful way to visualise data, using colour intensity to representdifferent values. Whether you’re highlighting population density, sales performance,or survey results, a