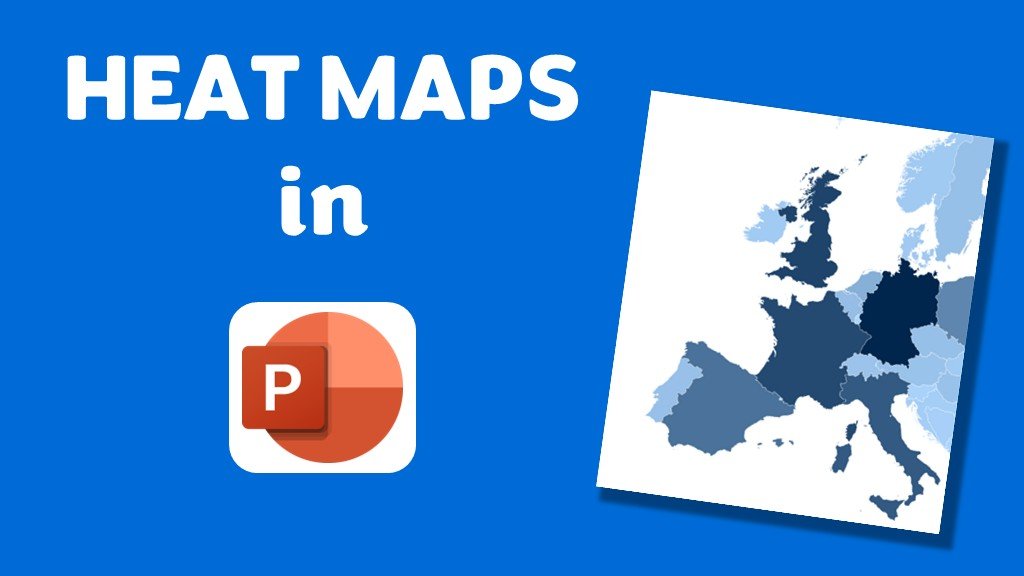
How to create a Heat Map in PowerPoint
Heat maps are a powerful way to visualise data, using colour intensity to representdifferent values. Whether you’re highlighting population density, sales performance,or survey results, a

Heat maps are a powerful way to visualise data, using colour intensity to representdifferent values. Whether you’re highlighting population density, sales performance,or survey results, a
I’ve always used PowerPoint for my social media posts, from YouTube thumbnails to LinkedIn banners and everything in between. It was a bit tricky getting